Review of Test Results
After the initialization process, users can view the results of their website testing on the Grafana dashboard. This dashboard provides a comprehensive overview of various metrics that reflect the performance and reliability of the tested website.
Example Test Result Dashboard
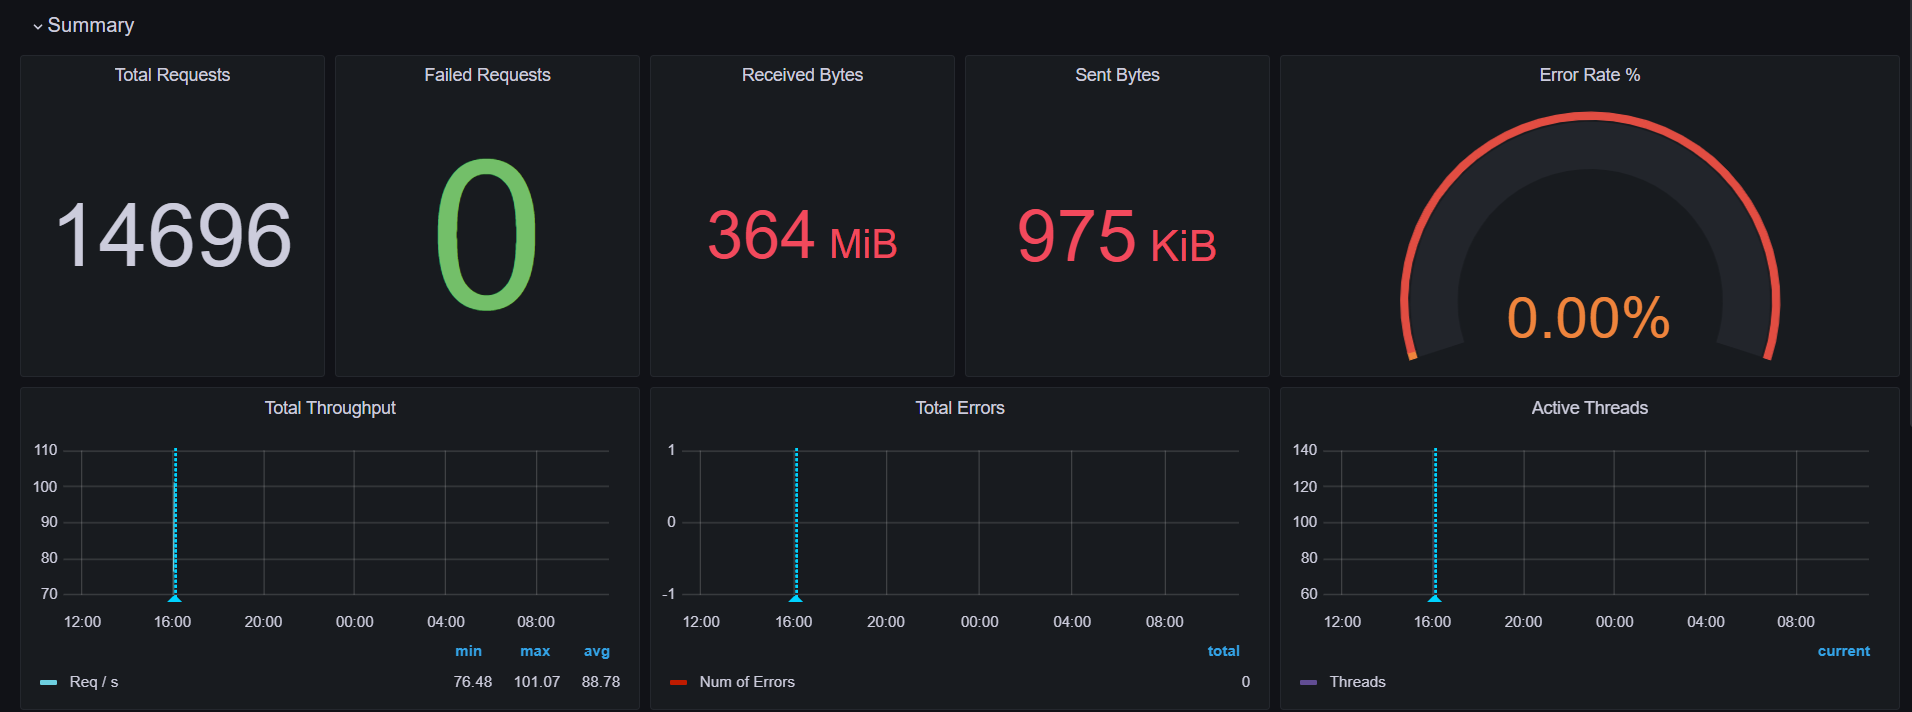
The above image showcases the Grafana dashboard displaying the metrics outlined. Users can quickly assess the performance of their website and make informed decisions based on the data presented.
Dashboard Metrics
The Grafana dashboard includes the following key metrics:
Total Requests
This metric indicates the total number of requests made to the tested website during the testing period. It provides a clear picture of the traffic that the site received, which is essential for understanding load patterns and user interactions.
Failed Requests
This metric shows the number of requests that failed to complete successfully. Failed requests could be due to various reasons, such as server errors, connectivity issues, or incorrect URL endpoints. Monitoring failed requests helps identify potential issues with the website and aids in troubleshooting.
Received Bytes
This metric represents the total amount of data received from the server in response to requests. It helps assess the size of the responses and can be useful for understanding bandwidth usage. A high number of received bytes may indicate large resources being served, such as images or videos.
Sent Bytes
This metric indicates the total number of bytes sent to the server by the client. It includes the data sent in requests, such as form submissions or API calls. Monitoring sent bytes is important for evaluating how much data is transmitted during interactions with the website.
Error Rate
The error rate metric indicates the percentage of requests that resulted in errors compared to the total number of requests. This is crucial for assessing website reliability and identifying potential issues that may affect user experience.
Total Throughput
This metric measures the total amount of data processed by the server over a specific time period, represented in requests per second (RPS). High throughput indicates that the server can handle a significant amount of traffic efficiently.
Total Errors
This metric tracks the total number of errors encountered during the testing process. It helps in pinpointing issues that need to be addressed to improve the website's performance.
Active Threads
This metric visualizes the number of active threads being utilized during the testing process. Monitoring active threads helps identify how many concurrent processes are running and can indicate the load on the server.
Other Diagrams
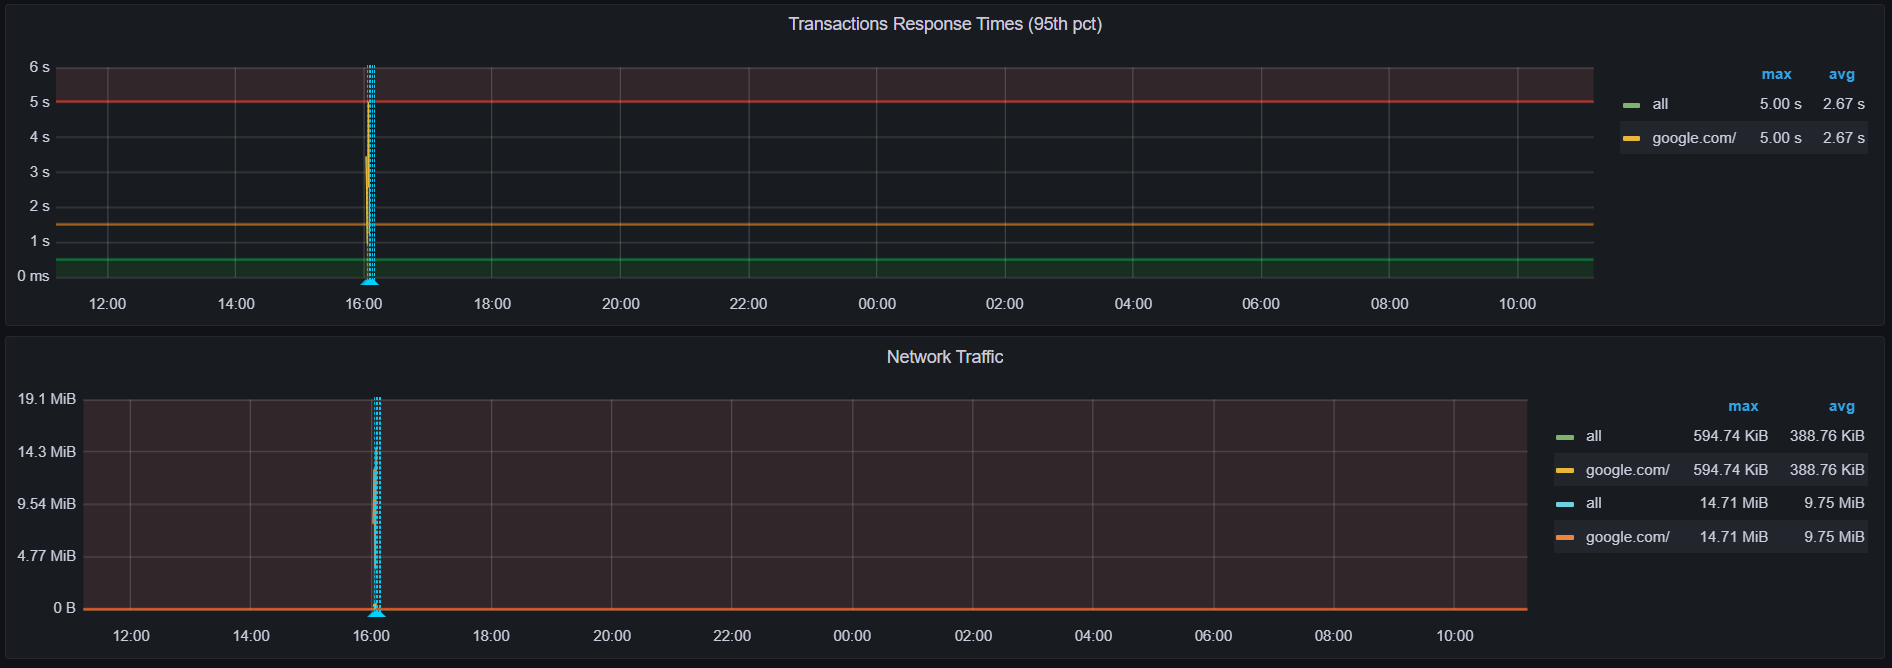
Transaction Response Times
This metric provides insights into the response times for various transactions made to the website. Understanding response times is essential for identifying performance bottlenecks and ensuring a smooth user experience.
Network Traffic
This metric visualizes the amount of data being transferred over the network during the testing session. Monitoring network traffic helps in understanding bandwidth usage and optimizing resource delivery.
These dashboard is an essential tool for users, providing them with valuable insights into their website's performance. By monitoring key metrics such as total requests, failed requests, received bytes, sent bytes, and errors, users can effectively troubleshoot issues and optimize their websites for better performance.